|
|
|


|
|
|
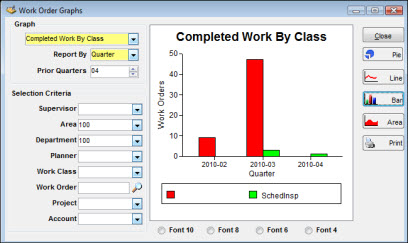
A graph is an illustration of data from the work order file. For a single work order or group of work orders, you can display graphs depicting the following data:
Progress (planned versus actual)
Completed work by class
Schedule compliance
The type of views available include pie, line, bar, and area. You also have the option of entering selection criteria for narrowing and focusing the data displayed.
To Display a Graph:
|
1. |
Click the Go To button on the Work Order Search window. |
|
2. |
Select Work Order Graphs from the list to display the Work Order Graphs window. |
|
3. |
Use the dropdown list under the Graph heading to select a graph title. |
|
4. |
Choose Year, Quarter, Month, or Period from the dropdown list in the Report By field. |
|
5. |
The next field label depends on your selection in the Report By field. This field name may be Prior Years, Prior Quarters, Prior Months, or Prior Period. Enter a number or use the mini-scroll bars to select the number of prior time periods to include with the current time period. |
Note: If, for example, you chose to report by Years, the caption for this box will read Prior Years.
|
6. |
Click the dropdown lists in the Selection Criteria panel to select the desired values and narrow the scope of data collected and displayed. |
|
7. |
Click one of the four view types on the right side of the panel to display the selected graph. |
Click the Close button to return to the previous panel. To print the graph currently displayed, select Print Window from the File menu.